
Background
Caltech biologists in Michael Elowitz’s lab have developed complex systems to grow, record, and analyze families of cells. Using videos taken with a microscope, they track the DNA information of lineages of cells as they divide into new ones.

Challenge
To find and analyse cells’ inheritance of DNA across time and in space, researchers cross-reference numerous videos and data diagrams at once. To look at the data involves a tedious process of arranging MATLAB windows and squinting at two screens. It is difficult to scan, visualize and understand the data at a glance.
Process


Preliminary Research
We began with preliminary research into what challenges biologists face as well as novel visualizations that may inform our work for visualizing trees of nodes with many pieces of attached metadata. We initially felt that a three-dimensional visualization of time + 2d space would make an informative core visualization for our system.
Contextual Inquiry
We documented the researchers lab space, software used, and documentation they made for themselves. From this we created an ideal user flow that researchers would engage in on a repeated basis. This included both an overview of all cell trees for analysis as well as a focus view for additional information.
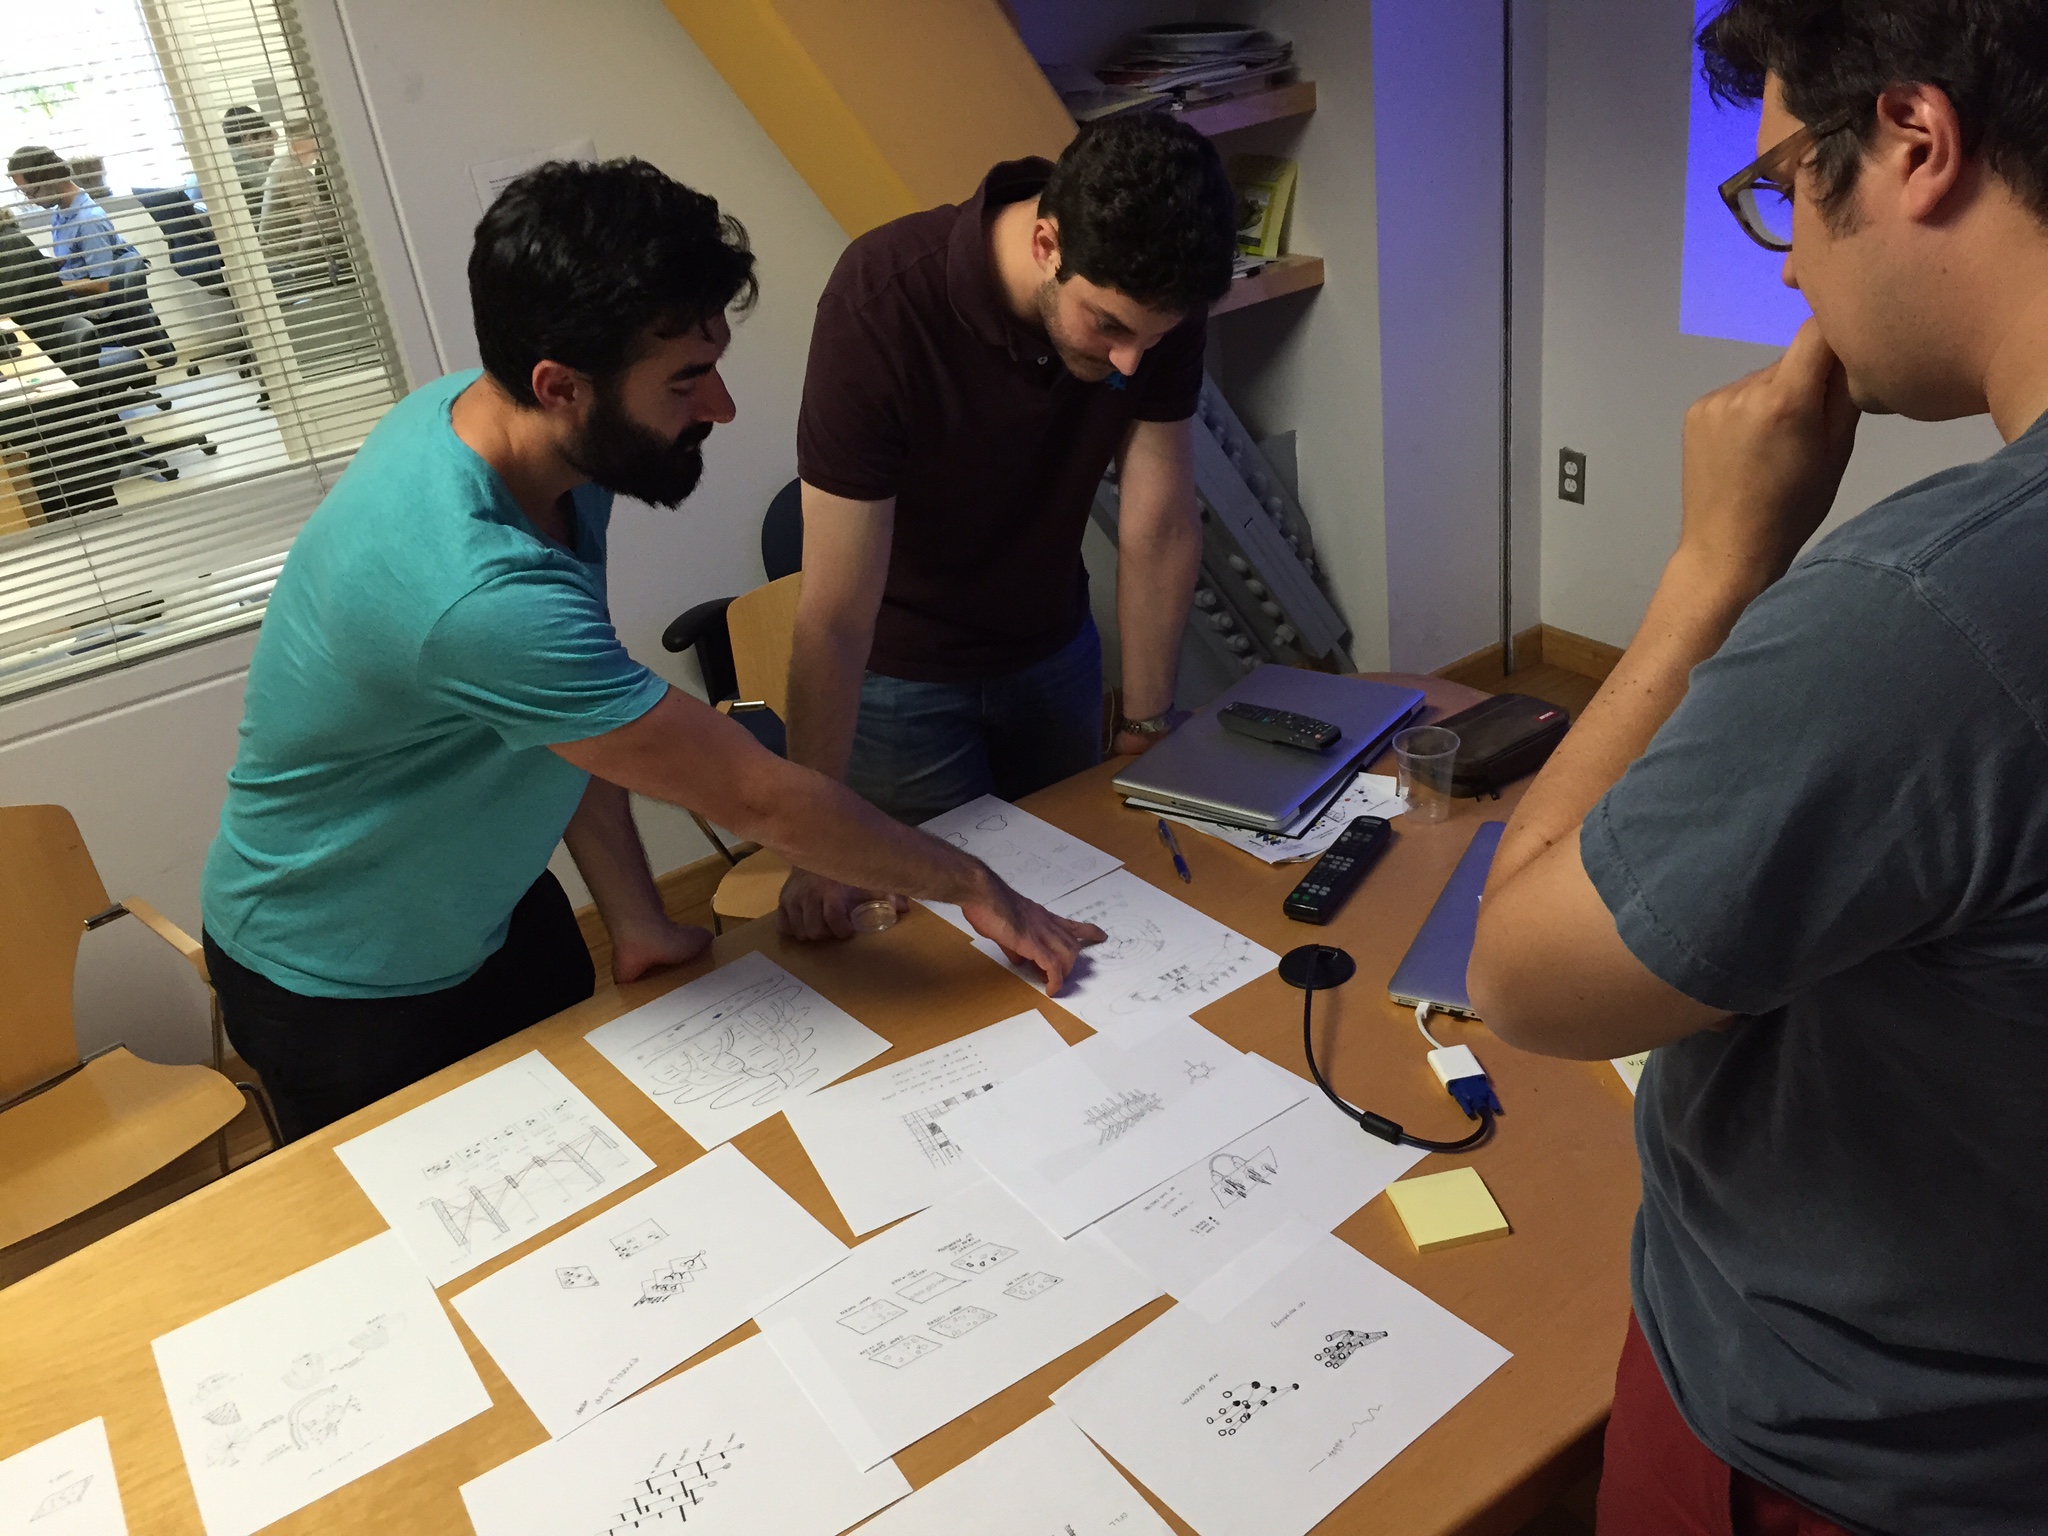
Reviewing sketches with research team.
Testing and Co-Design
Based on our idealized user flow, the preliminary research, and conversations with a consulting developer, we developed a variety of visualizations that we as designers felt could meet the needs of the researchers. We engaged in a number of fast iterations where we sketched ideas, showed them to the researchers, and got their feedback on how our designs could be applied to their data.

Sample of sketches for how to visualize the cell trees and some UI components that would be required to interact with visualizations.

Designs led to storyboards outlining possible interaction methodologies.

Utilizing off the shelf tools and fast prototyping software, interns generated visual models exploring a wide range of visual possibilities.

Mixed paper and screen prototyping enables us to quickly test interaction hypothesis, without having to design blindly or creating intricate working prototypes. We create a semi-wizard-of-oz system wherein the researchers points at printed panels of what they desire to do with the data, and the designers make changes on the fly.
Resolution
This process led to a final design, a hybrid 2d small multiple overview of the data paired with a three-dimensional detail view. The final result is working software, targeted to solve the needs of current hard scientific projects

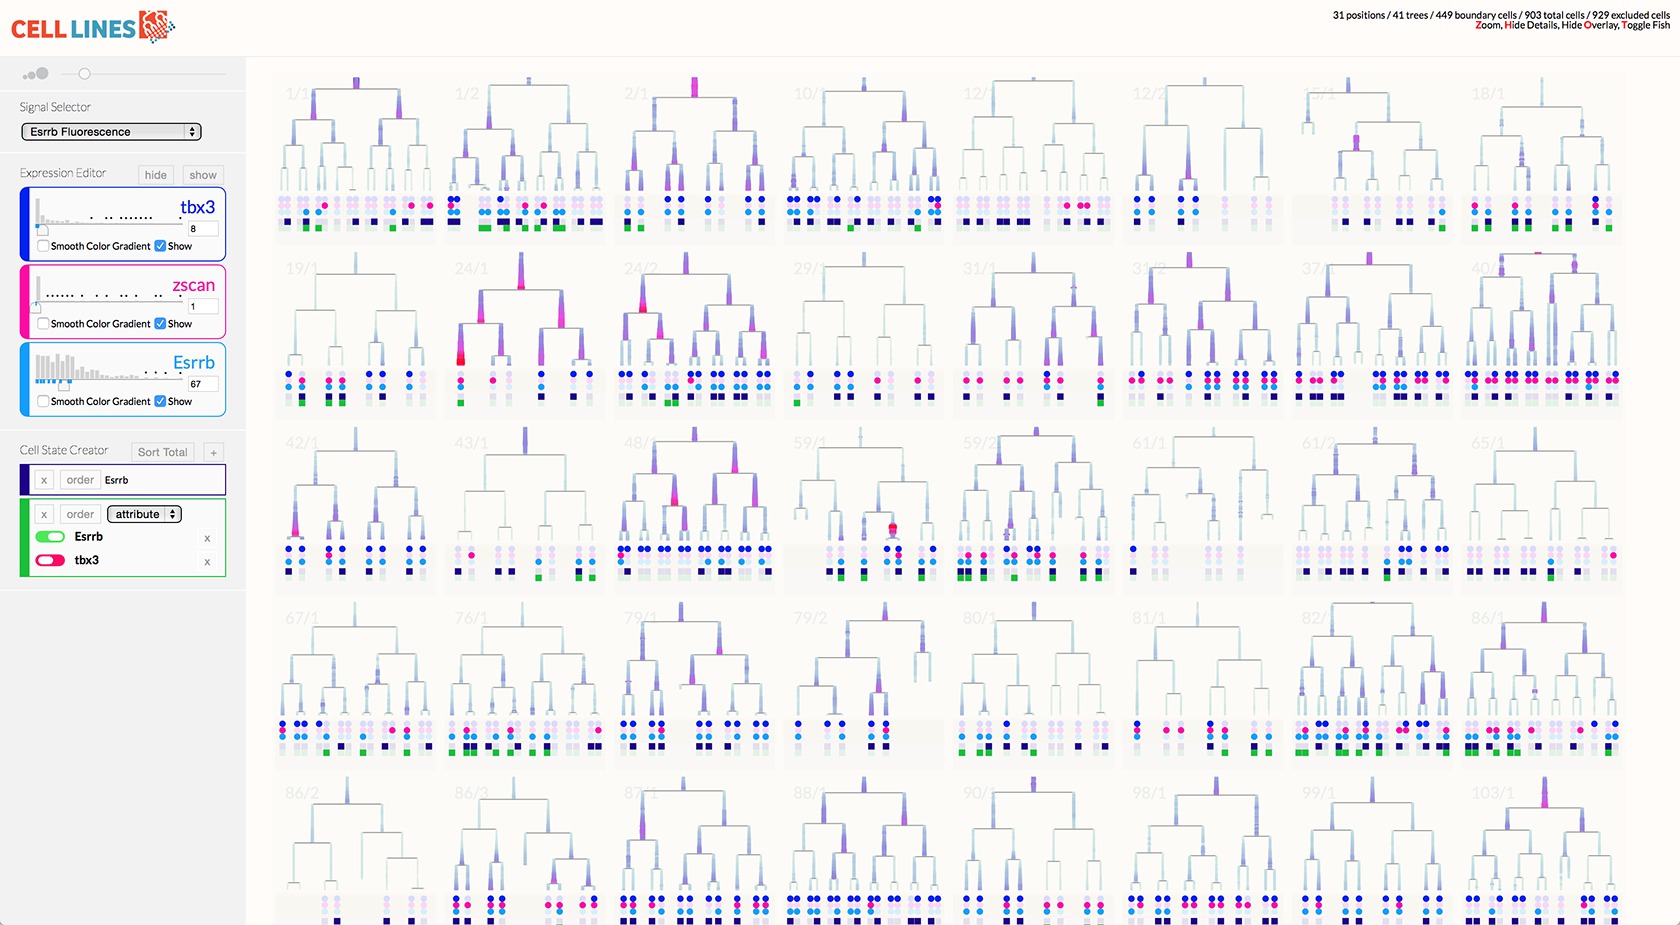
The most novel visualization aspect of the system is the scrubbable petri image window. This window also overlaid pre-analyzed metadata like lineage information and relationship distance.
Results offered layered solutions that tackle quick and intuitive inspection, as well as in depth analysis.
Recognition and Follow-on Funding
The Elowitz Lab invested $30K for Santiago Lombeyda to finalize and successfully launch the browser-based software. The software has also been shared with other labs. http://cellerie.caltech.edu/