Background
NASA/JPL Planetary geologists are looking for signs of past life on Mars by analyzing mineral patterns in Martian rock samples. To do this, they look at atomic-level resolution X-ray images (MicroXRF) of these samples. New data will be collected over the coming years from the Planetary Instrument for X-ray Lithochemistry (PIXL) heading to Mars in 2020.
Challenge
Researchers need to see and analyze the spatial distribution and relationships between elements and mineral compounds at various sites on Mars where samples are scanned.
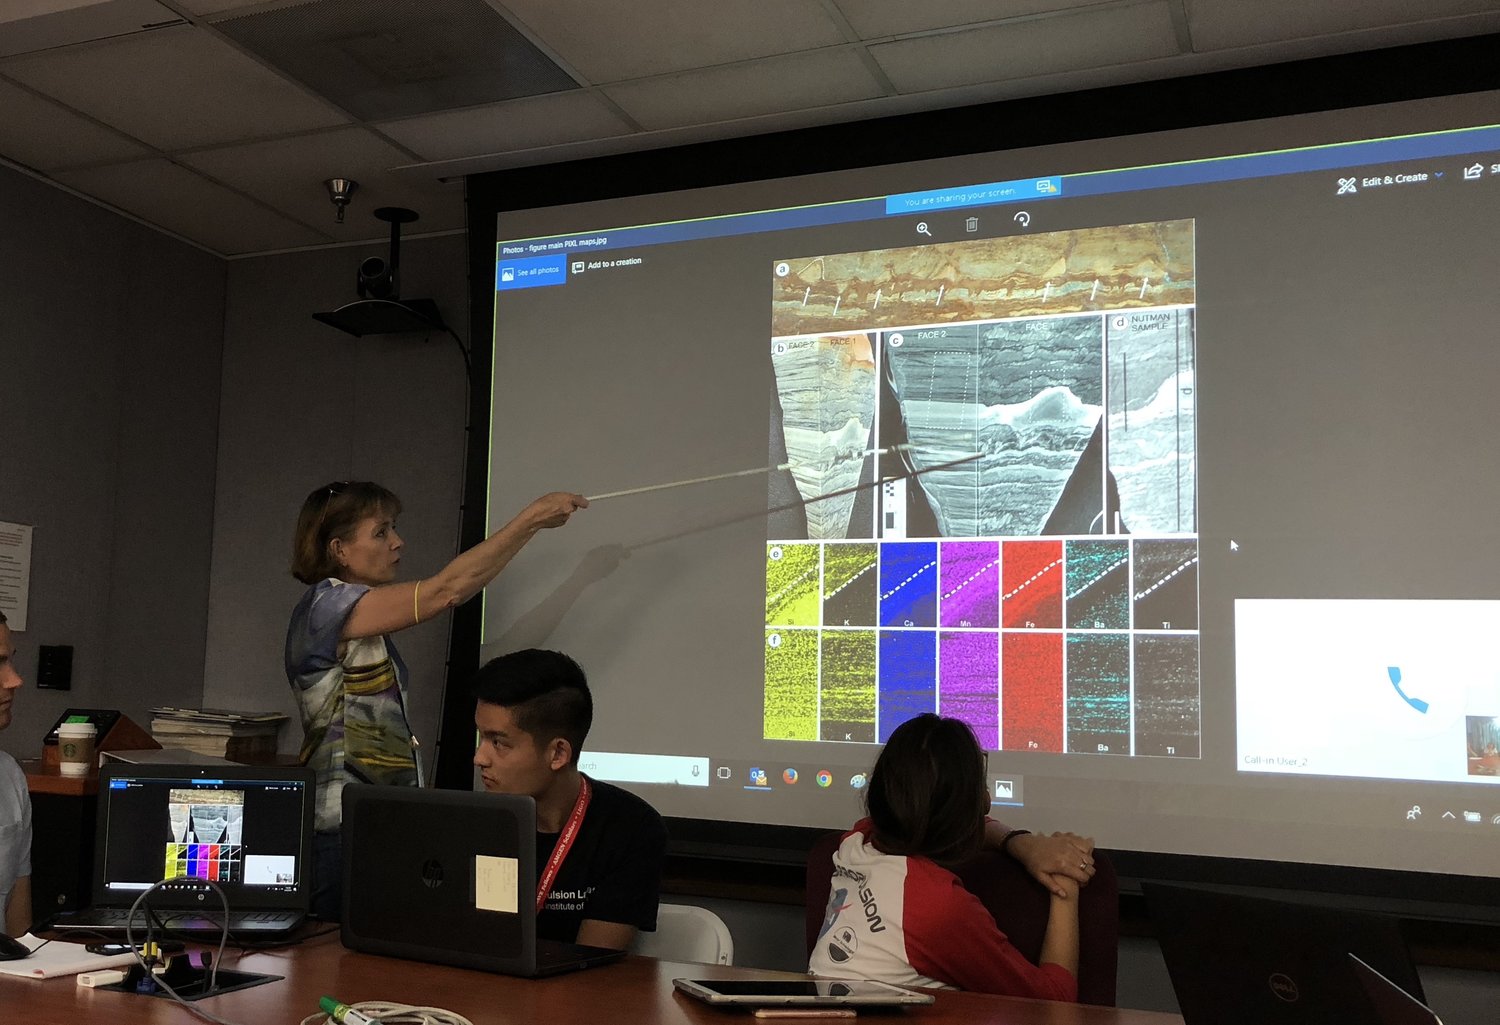
This involves looking at many images at once, overlaying many layers of information with varying amounts of opacity, and then searching for patterns across this visual field. They also need to cross-correlate the patterns they think they see with graphs that organize the statistical relationships between detected elements. There is a lot to look at and keep in mind at one time.
Process
Operating PIXL requires a small ecosystem of specialized software to capture, record, quantify and model the scan, and each scientist uses each tool a little differently. Using contextual inquiry and user-centered design, we developed new visual representation, interaction, and workflow for the PIXL team’s scientific analysis.

Preliminary Research
We began with preliminary research into what challenges astrobiologists face as well as novel visualizations that may inform our work.
Contextual Inquiry
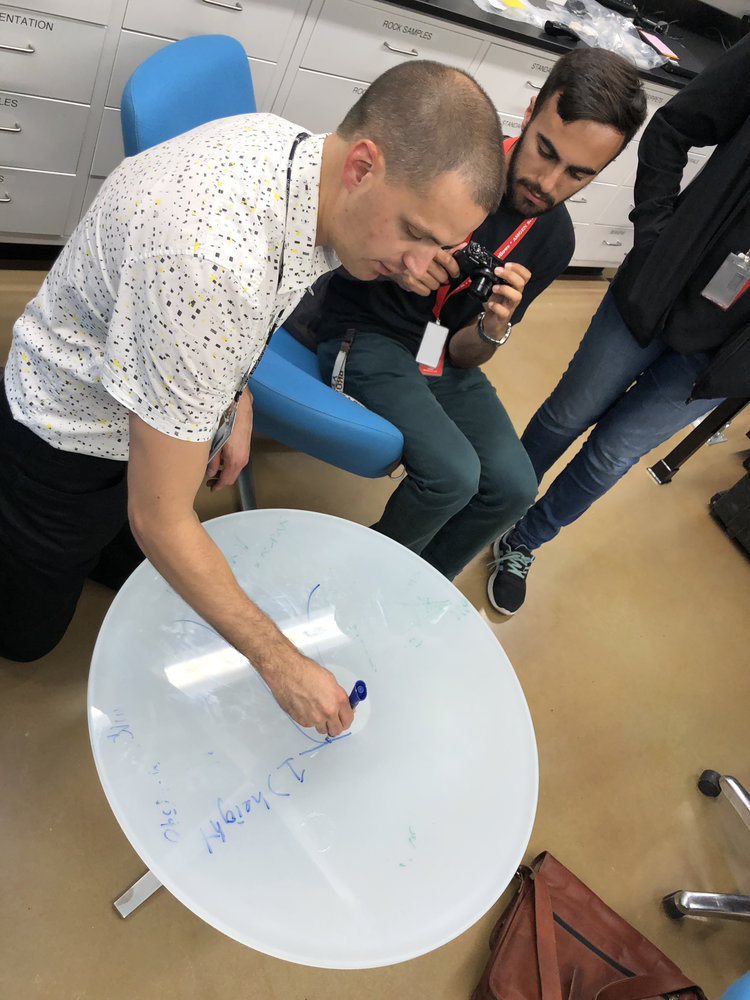
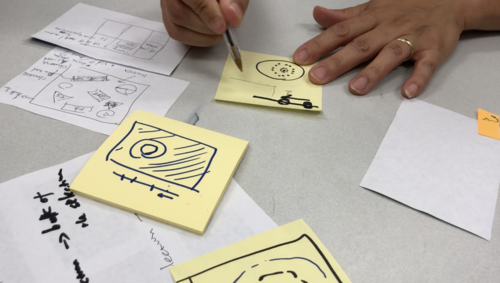
A foundational part of our process is identifying the key roles visual, interactive and computational practices play in our collaborators scientific research. To gain these insights we observe and document where and how our collaborators perform research. This includes scientists think aloud workflow sessions. For this project, we observed where and how our collaborators take microXRF scans of geologic samples and analyze them. We then created sketches and a workflow timeline map to discuss what we think we understood.

Testing and Co-Design
As the process advances, we build dynamic prototypes that include hybrid paper/digital interfaces, code and real data. To test how the prototypes help our collaborating scientists see, interact with and analyze the data, we work with them to perform imagined research session in which we revise the paper front end and digital back end on the fly.
Resolution
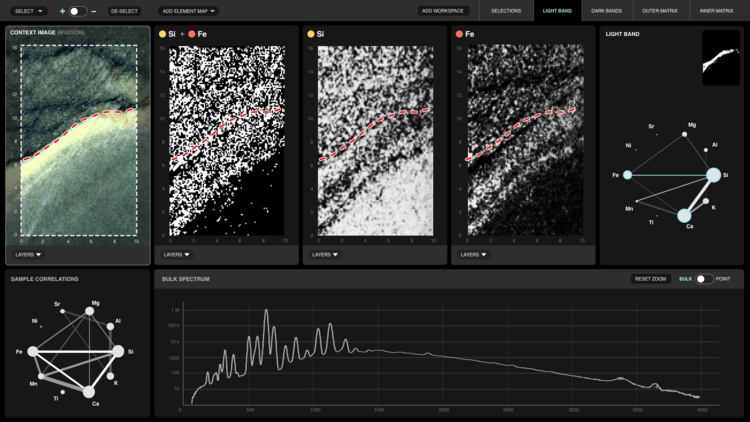
PIXLATE enables scientists to generate, cross-compare, and analyse 2D element maps and x-ray spectra as well as correlate the information with a new form of visual diagram.
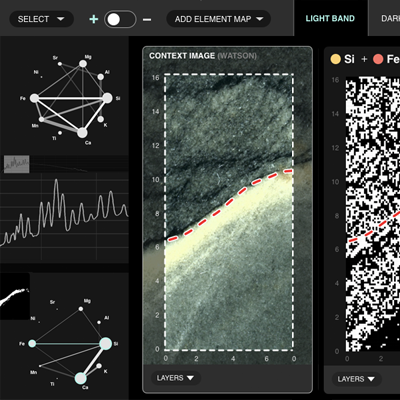
Chord Diagram
The chord diagram gives an informative at-a-glance view of a dataset. The ten nodes correspond to the ten elements most useful for understanding a rock sample. The width of the circles are proportional to relative abundance of each element, and width of the chord connecting two circles is proportional to the spatial correlation of those two elements.

Intersectional Mask
Intersection masks show how different elements co-vary throughout a sample by highlighting only the pixels containing selected elements.

Selection Tools
Photoshop-like tools allow the user to precisely select key regions of a rock sample for further analysis. They include color select, line select, and lasso.

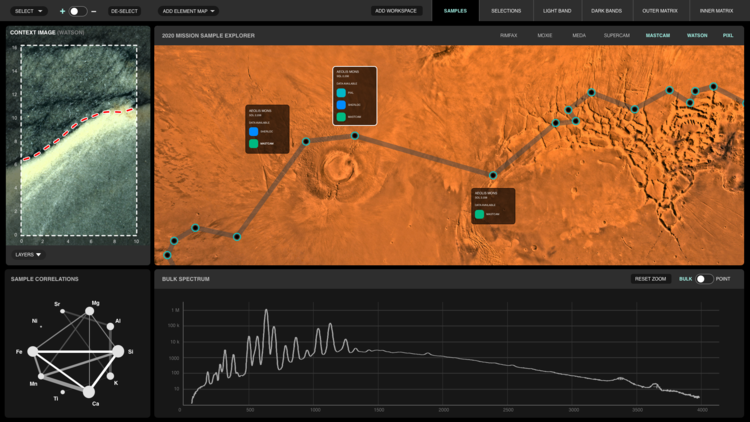
Workspaces
Multiple customizable and nameable workspaces subdivide different parts of the visualization and analysis processes. This organization enables scientists to see and think more clearly.

Recognition and Follow-on Funding
PIXL8 was presented by students at AbSciCon, the AGU Conference on Astrobiology.
Schurman, David; Nair, Pooja; Davidoff, Scott; Galvin, Adrian; Allwood, Abigail; Liu, Yang; Flannery, David; Hodyss, Robert P.; Lombeyda, Santiago; Hendrie, Maggie; Mushkin, Hillary; Heirwegh, Christopher (2019). PIXELATE: Novel Visualization and Computational Methods for the Analysis of Astrobiological Spectroscopy Data. In Proceedings of the 2019 Astrobiology Science Conference.
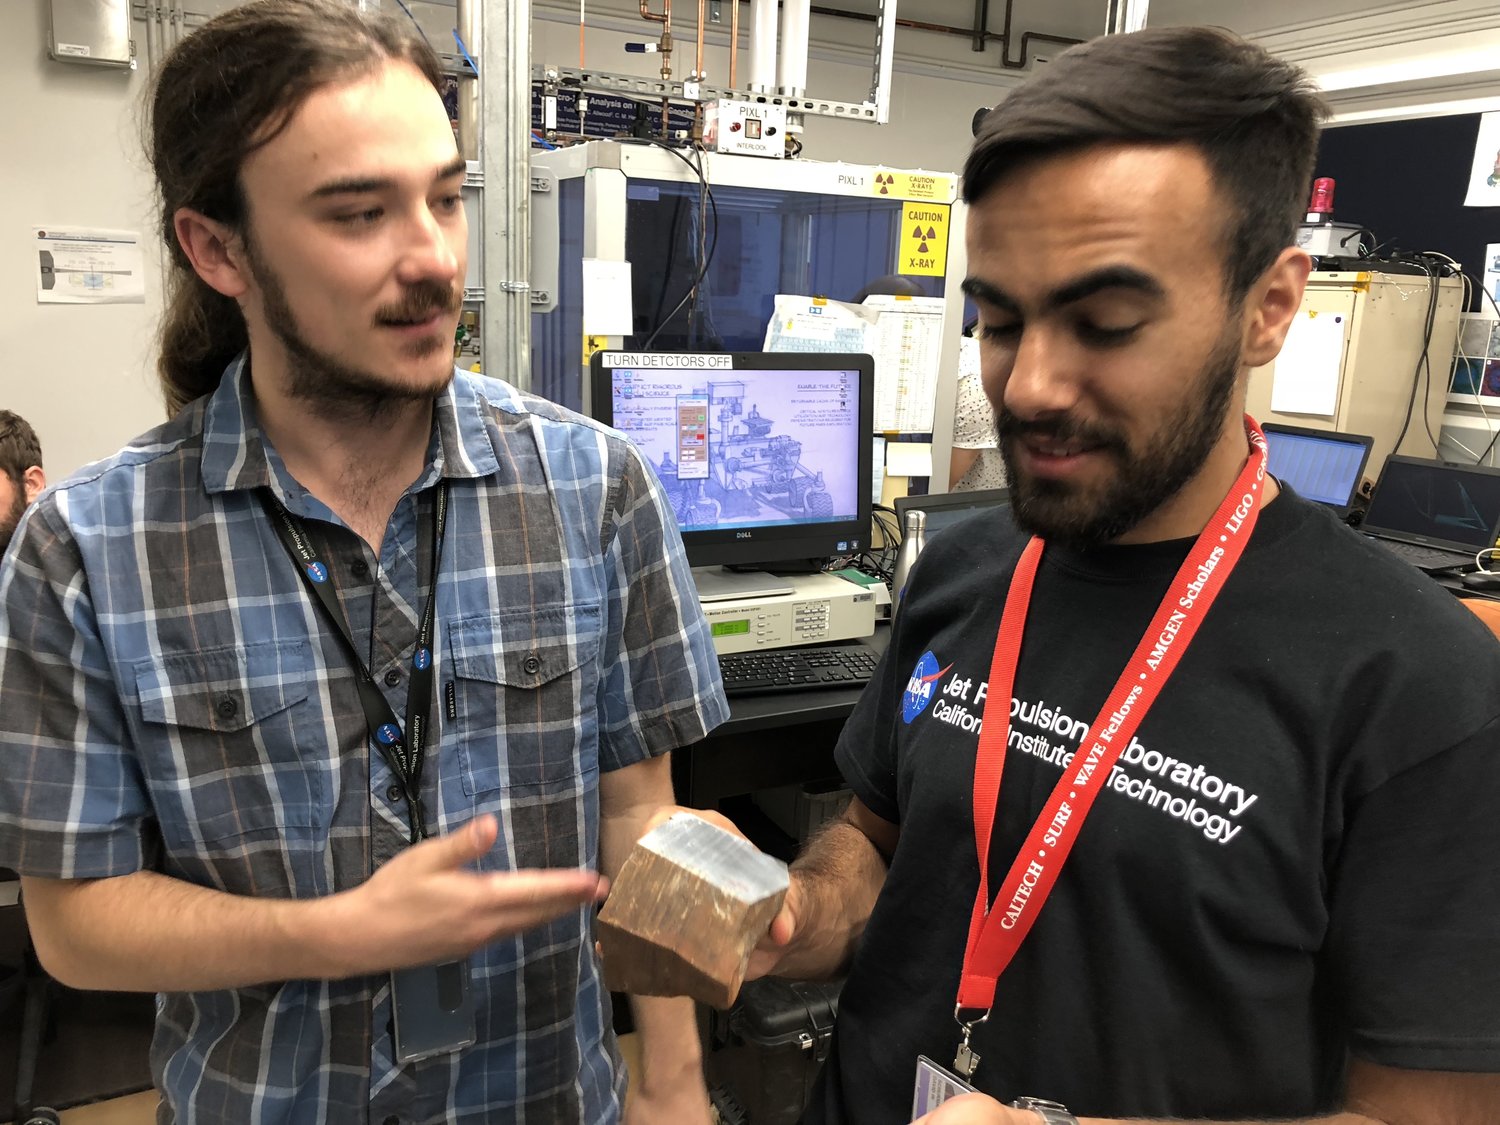
Data to Discovery’s Scott Davidoff (JPL) worked with our collaborator Dr. Abigail Allwood (JPL) and interns David Sherman and Pooja Nair to further develop PIXL8 into a tool called PIXILIZE, and make it open source. Follow on funding included $50k from the JPL Data Science program for studies of Machine Learning for Astrobiology; $690k from JPL; and $200k from Queensland University of Technology (QUT).
PIXLIZE was adopted in July 2019 as the primary ground data interface for Mars 2020’s PIXL instrument. It is also part of an Australian PIXL Operations Center based at QUT and sponsored by the Australian Space Agency and Australian Research Council to allow round-the-clock analysis of PIXL data using PIXLIZE.
Text and images used with the permission of Adrian Galvin: http://adriangalvin.space/pixelate
Photo credit: Caltech-JPL-Art Center Visualization Program / Mars 2020 Planetary Instrument for X-ray Lithochemistry (PIXL)
Beyond the Mars 2020 Mission
Although PIXLISE’s story began on the Red Planet, it continues to unfold on our home planet. After years of close collaboration with scientists, engineers, and designers at multiple research institutions, we realized PIXLISE can do much more than its original mission. We are developing a multi-level deployment process which will bring PIXLISE’s sophisticated visualization and analysis capability to scientists in geology labs across the globe.
As of 2023 PIXLISE is available online to try at https://www.pixlise.org/, or download at  https://github.com/pixlise/.